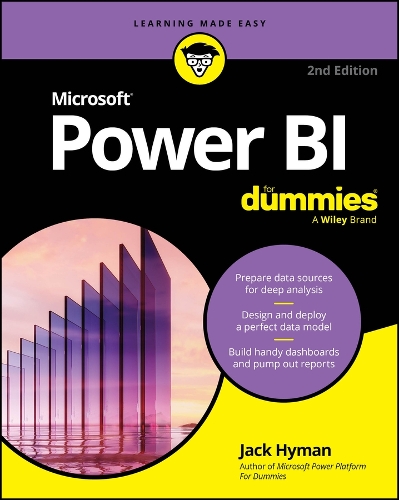
Free Santander Course - Power BI Fundamentals
This introductory Power BI course is for individuals who want to delve into data analysis.
You'll learn how to use Power BI to import data, create visual reports and charts, interact with it, and apply filters to explore the information in your data sets. Additionally, we will teach you how to transform data with the Power Query editor, which will improve the performance and presentation of your data effectively.
About the course
What you will learn
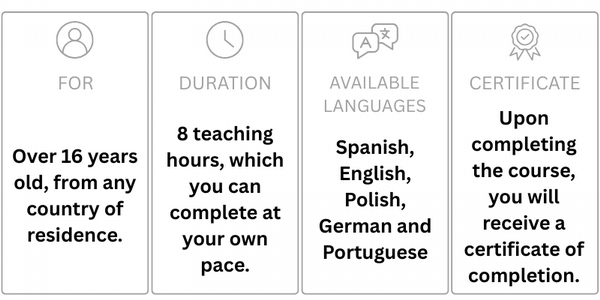
Learn how to get started with data analysis with Power BI: import, analyse, and visualise data, and learn how to optimise its presentation with the Power Query editor.
- What is Power BI?
- Download Power BI desktop
- Power BI window
- Data Importing
- How to format columns
- Creating your first reports in Power BI
- Additional reports
- Filter panel
- Conditional formats
- Introduction to Power Query


By Santander Open Academy
Santander Open Academy gives free access to learning to boost your career. Explore hundreds of courses on everything from AI to leadership to sustainability - giving you the skills you need to succeed in today's competitive world.
All courses are completely free.
Learning content is on demand, learn at your own pace.
You don't need to be a Santander customer to access.
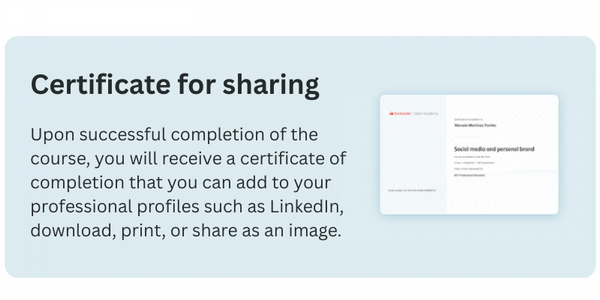
Certificate of completion available when you finish each course.

More articles in this category:
- Free Santander Course - Digital Marketing
- Free Santander Course - Introduction to Python Programming
- Free Santander Course - Excel From Basics to Intermediate
University of Salford, Student Support
Academic skills support: www.salford.ac.uk/skills
Careers support: www.salford.ac.uk/careers
Access free e-learning to develop skills, employability, and learn something new:
Academic skills: develop study, research, digital and numeracy skills
Employability Skills and Career Essentials: key skills that employers need and how you can develop and evidence them.
LinkedIn Learning: technology and workplace skills